

JAN 15 TH… CRYSTAL BALL AT 2024
RISKY TIMES AHEAD?
With 22 Years of Experience
I OPEN THE 2024 Crystal Ball IN THIS VIDEO
I show you the future 2024 MARKET predictions in this short video
FYI: I WAS 95% CORRECT IN MY 2023 PREDICTIONS…..
Will Seller’s (who had a 35% 3 Year gain in 3 years) get flatlined this year?
2. Will Buyers run the game this year and get better prices than last as more seller’s sell ?
3. How many rate cuts are coming and in what part of the year?
I TELL YOU ALL OF THIS JUST
CLICK THE PHOTO BELOW TO FIND OUT AND WATCH THE SHORT VIDEO
.
Spring Market starts Super-bowl Sunday.... Call me now for a Free Market Analysis...312-953-6725
To see HOW I get you more money, faster and keep it hassle free see my videos below on "How I get you top dollar... etc."

BELOW IS A review of 2023…

I will do a no obligation confidential consult text 312-953-6725
A review of 2023…
MY 5 PREDICTIONS FOR 2023 WERE CORRECT
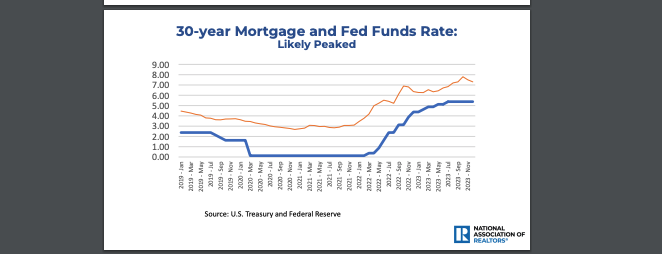
I predicted rates of 6.5% at end of year, would not go down end 2023 about 6.45% level.
I predicted huge drop in #sales & that the number of available homes would drop to 20 year low.
I said Buyers will had to compete for deals and pay 5% more on average across Chicag
I said market time would drop yet again and bottom out about 60 days
Inventory will drop another 15%.- CORRECT (but it dropped even further down 24%)
The 5 KEY Stats FOR 2023 my predictions - ALL CORRECT
Mortgage rates 30-year fixed-rate mortgage dipped a bit but averaged 6.48% - CORRECT
3.22%.hit 9.3% fewer properties sold in 2023 - the lowest on record in 20 years.-CORRECT
Chicago’s median home sale price rose 5% in one year - CORRECT.
The City of Chicago Market times dropped another 7% to 63 days in the last year. - CORRECT
Chicago Inventory dropped a whopping 24 % - an amazing dip. This will correct this year.-CORRECT
Check out the November 2023 FastStats.

Make it stand out
Are you ready to unlock the secrets of a thriving real estate portfolio that generates passive income, allowing you to live life on your own terms? Look no further. Our gathering is designed to empower you with the mindset, strategies, and 'nuts and bolts' of buying and owning property for financial freedom.
Learn from some pro's who have already walked the path to financial independence and succeeded.
We believe in the power of collaboration. Connect with fellow investors, whether you're just starting or a seasoned pro. Share your experiences, ask questions, and discover new perspectives during our engaging sessions.
Our sessions are informal and focus on various themes( and we like to eat and drink while we meet and/or after). Topics will range from finding the hottest deals on the market to exploring innovative loan products for multi-family holds and flips. Learn the real strategies to creatively boost cash flow, navigate city inspections, tackle Section 8 challenges, and master the art of frugal property rehab.
And here's the cherry on top: We'll uncover the 'street smart' tips that aren't often discussed. Discover how to convert extra spaces in your properties into income generators. Demystify the world of 'in-law' apartments and gain insights on valuing properties that feature them.
more details on 2023 (LAST YEAR)…
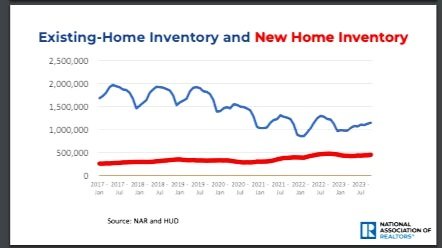
IN 2023 Low inventory, elevated sales prices, and decades-high interest rates continue to weigh on the housing market, which caused sales of existing homes to fall to their slowest pace since August 2010. According to the National Association of REALTORS® (NAR), U.S. existing-home sales declined 4.1% month-over-month and 14.6% year-over-year as of last measure, as prospective buyers, faced with rising homeownership costs, wait for mortgage rates, and home prices, to drop.
At the end of 2023 the Inventory remained at historically low levels nationwide, with only 1.15 million homes for sale heading into November, a 5.7% decline compared to the same time last year, for a 3.6 months’ supply at the current sales pace. In Chicago it remained below 3 months for all property types. The shortage of available properties for sale has kept pressure on home prices, which have continued to climb despite the slowdown in sales. According to NAR, the U.S. median existing-home sales price increased 3.4% from a year ago to $391,800, an all-time high for the month, with annual price gains reported in all four regions of the country—- including Chicagoland
Rates are starting the year better than last year…. The 30-year fixed-rate mortgage averaged 6.48% in the week ending January 5, up from 6.42% the week before, according to Freddie Mac. It’s the highest start to a year since 2002, which opened at 7.14%. A year ago, the 30-year fixed rate was 3.22%..
A year ago, the 30-year fixed rate was

CLICK HERE TO
GET A QUOTE FROM MY PREFERRED LENDERS
I PROMISE WHO I REFER
HAS BEEN IN THE BUSINESS LONGER THAN ME…
(22 YEARS)
EXPERIENCE COUNTS AS A BROKER AND AS A MORTGAGE SPECIALIST
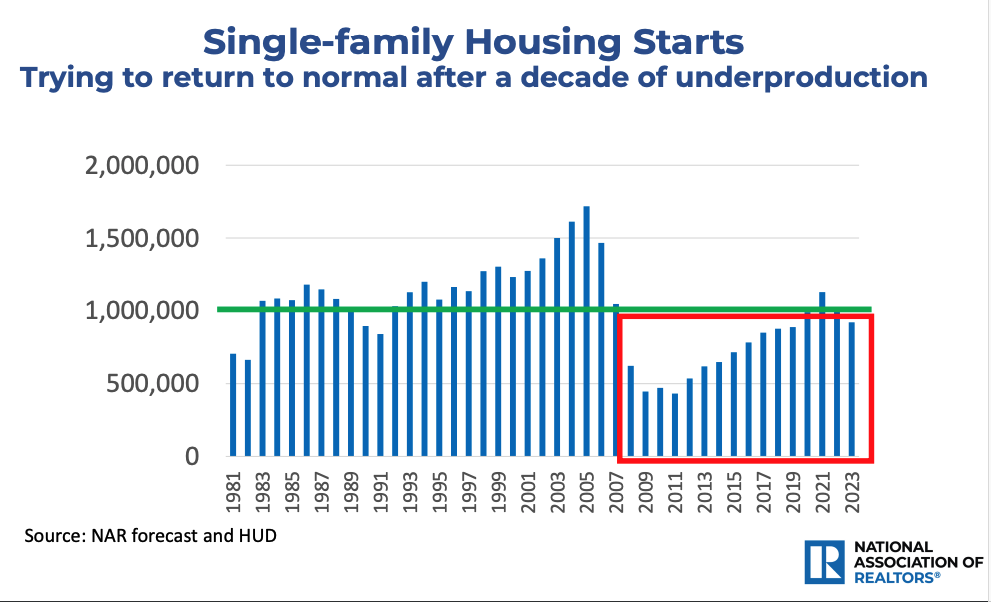
2024 - U.S. MARKET FORECAST

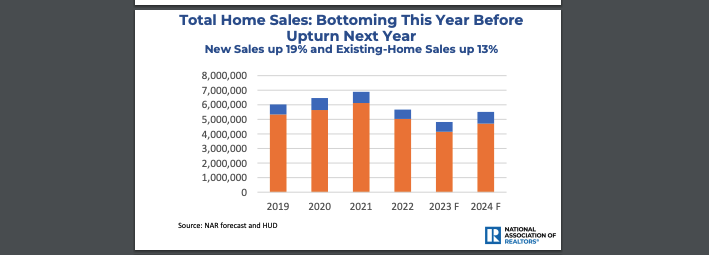
NOTE THE BUMP in the 2024 BAR .
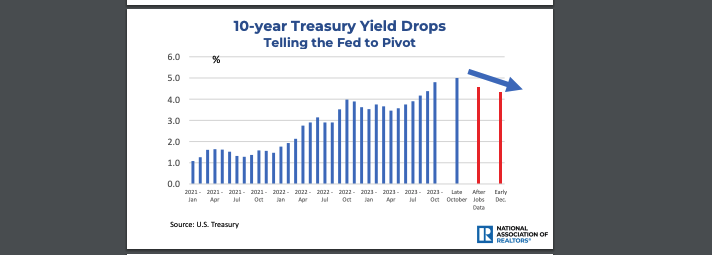
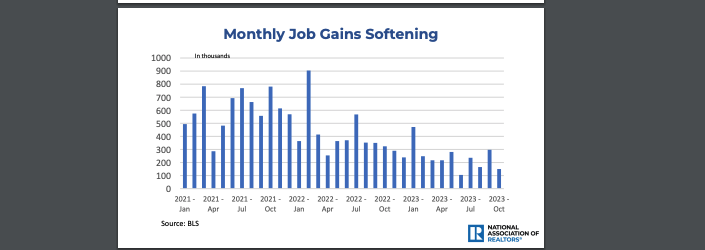
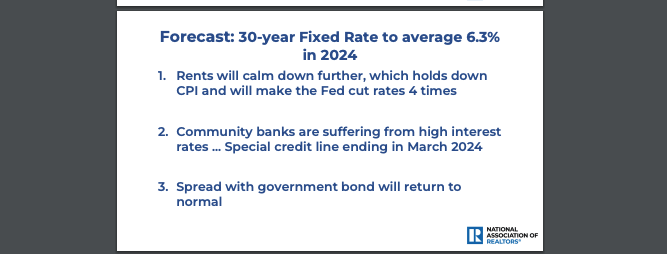
THE PREDICTION FOR THE MARKET IN THE U.S. ARE THAT # HOME SALES WILL INCREASE 18% AFTER A HISTORIC LOW IN 2023 AS THE FEDS CUT RATES UP TO 4 TIMES OVER THE YEAR.
for those of you who love data
“NERD OUT” ON MORE 2023
chicagoland mls GRAPHS….
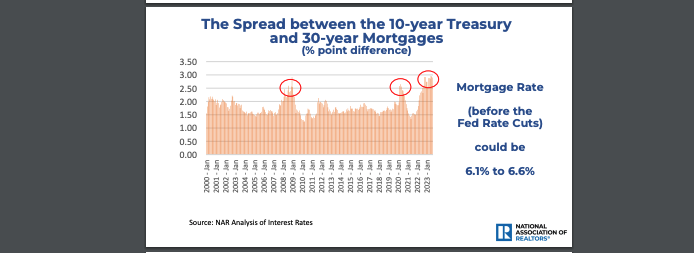
USEFUL NATIONAL CHARTS BELOW SHOW HOME INVENTORY INCREASES COMING, ALL SIGNS POINT TO FEDS CUTTING RATES HOME SALE INCREASES, BUYER DOWN PAYMENTS WILL REMAIN LOWER SCALE, RENTS ARE SOFTENING FROM COVID 22 PEAKS, THE NUMBER OF SINGLE FAMILY HOME STARTS IS STILL WAY BEHIND THE DEMAND FOR HOMES COUNTRYWIDE,

This is the Market summary coming out of the end of the year for 2023.

The median sales price in the City of Chicago for November 2023 was $323,000, which is a 5.0% increase from November 2022. Condos rose less in price than homes but still held an increase of about 4%.

IN CHICAGO Affordability is out of whack. The ability of buyers to buy is at historic lows… along with the inventory being dramatically low… and below what I have ever seen it in 22 years.

This is dramatically low inventory FOR CHICAGO - I have never seen it this low. There is less than 3 months of homes on the market… This is why seller’s are getting slightly higher prices each month… a increase of about 5% for the year of 2023 across Chicago. The condo inventory… the blue line is also historically low.
new homeowner tool …
ONLINE TOOL ON MEASURING YOUR TAXES

Cook County Treasurer Maria Pappas launched a new online tool that calculates year-to-year changes for each property tax bill and shows where tax dollars go.
The new feature, called “Where Your Money Goes,” is an online, educational display that provides a clear view of how much taxes owed on a property increased or decreased from one year to the next. It also calculates the money an individual property owner owed to each school district or other local unit of government in the past two years.
To access the new tool:
Search for a property by Property Index Number (PIN) or address.
Select the correct property and click, “View Your Property Tax Information.”